目次 [ Contents ]
This article is about how to draw texts and values on screen. Please read after previous and the time before last.
Wiring
Wiring is same as previous instruction. You also need variable resistor. This wiring diagram is I2C connection. Please check here if your screen is SPI connection. 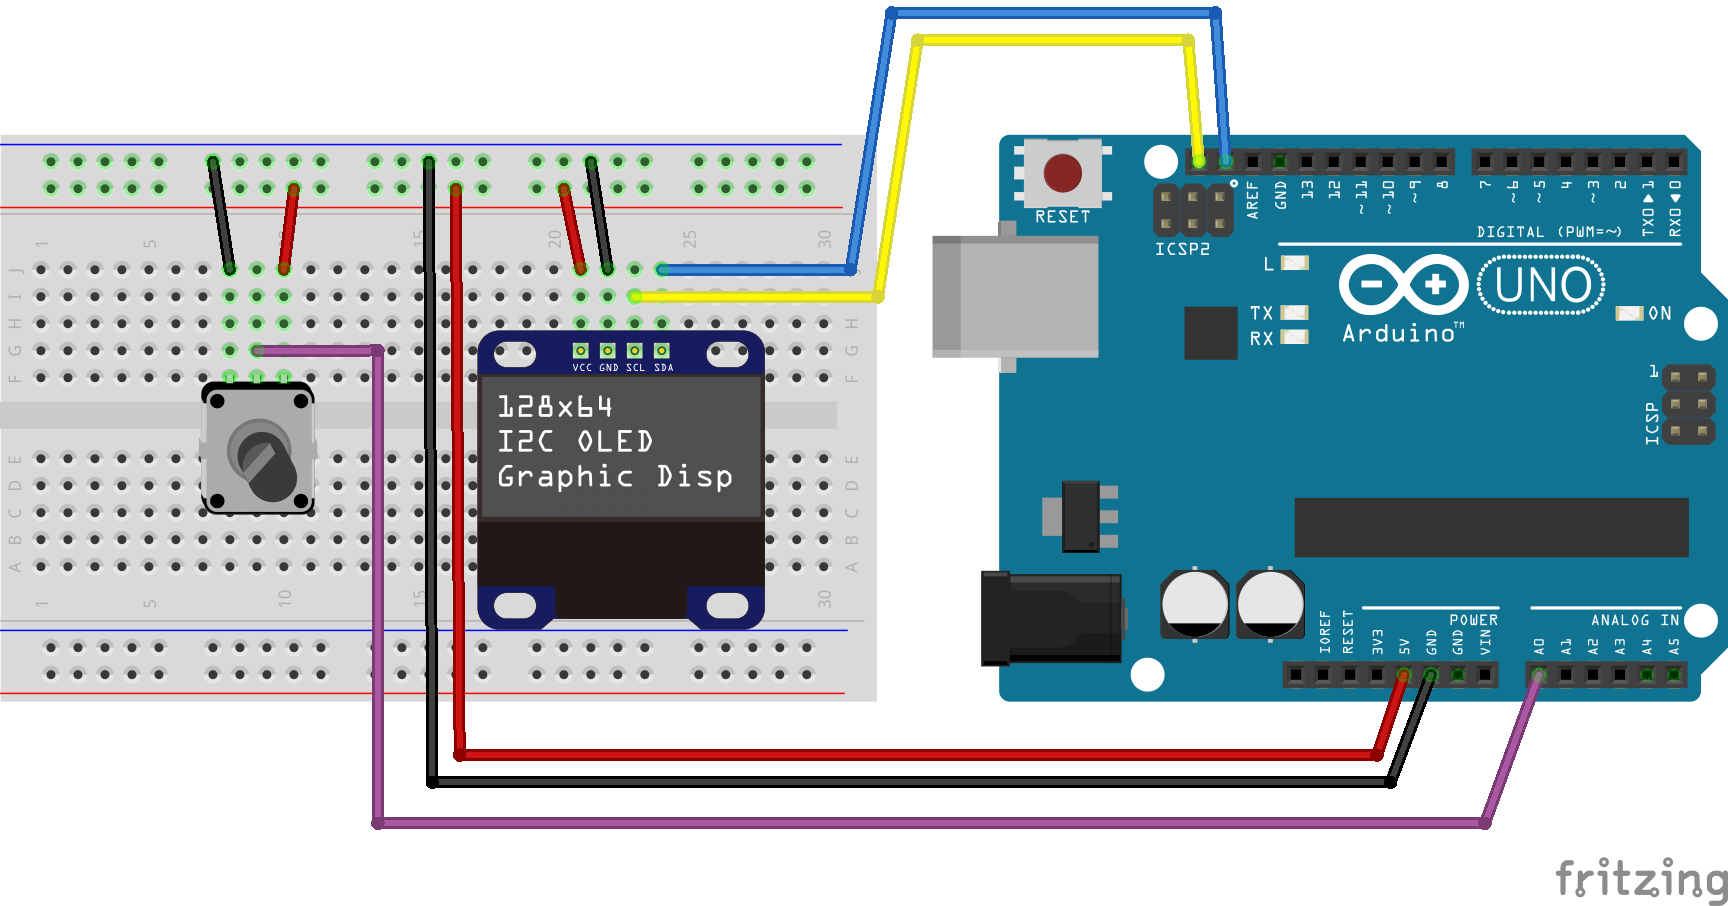
Review
Based on the review, I will write sketch using the variable resistor, first.
#include "U8glib.h"

//U8GLIB_SSD1306_128X64 u8g(4, 5, 6, 7);   // SPI connection
U8GLIB_SSD1306_128X64 u8g(U8G_I2C_OPT_DEV_0 | U8G_I2C_OPT_NO_ACK | U8G_I2C_OPT_FAST);

#define VOL  A0
#define VMAX 1013
int vol_val = 0;


void setup() {
  pinMode(VOL, INPUT);
  u8g.setColorIndex(1);
}


void loop() {

  vol_val = 0.9 * vol_val + 0.1 * analogRead(VOL);

  byte val = map(vol_val, 0, VMAX, 0, 127);

  u8g.firstPage();
  do {

    u8g.drawBox(0, 60, val, 3);

  } while (u8g.nextPage());
}
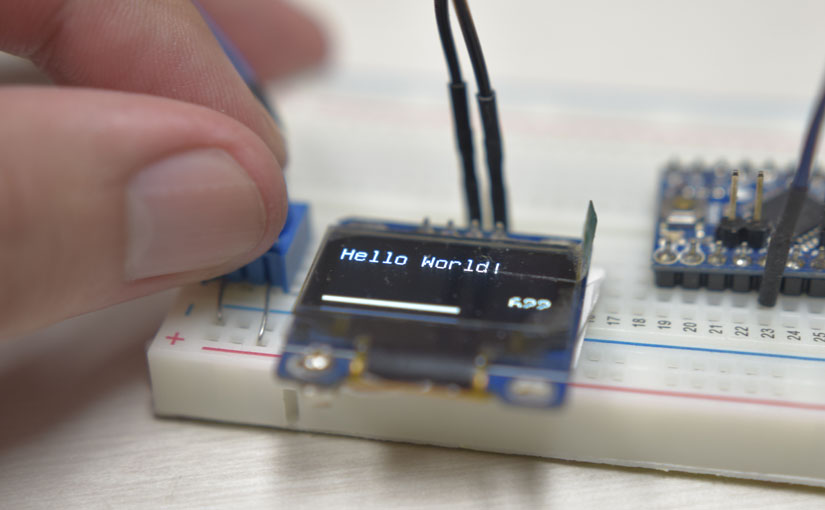
This sketch has been updated than the last time. And it is basic sketch in this article.
Draw characters on screen
If you want to display strings by “u8glib”,
1. Set Font
2. Set Position and cast strings
Font is kept once you set it. So if you won’t use several fonts, you can omit process 1 for each draw.
#include "U8glib.h"

//U8GLIB_SSD1306_128X64 u8g(4, 5, 6, 7);
U8GLIB_SSD1306_128X64 u8g(U8G_I2C_OPT_DEV_0 | U8G_I2C_OPT_NO_ACK | U8G_I2C_OPT_FAST);

#define VOL  A0
#define VMAX 1013
int vol_val = 0;


void setup() {
  pinMode(VOL, INPUT);
  u8g.setColorIndex(1);
}


void loop() {

  vol_val = 0.9 * vol_val + 0.1 * analogRead(VOL);

  byte val = map(vol_val, 0, VMAX, 0, 127);

  u8g.firstPage();
  do {

    u8g.setFont(u8g_font_unifont);
    u8g.drawStr( 0, 22, "Hello World!");

    u8g.drawBox(0, 60, val, 3);

  } while (u8g.nextPage());
}
Set Font
What you need to set the font,
u8g.setFont( font name );
Font has been prepared in advance in the “u8glib” library. And it is packed in the sketch at compiling. So if you add more font, sketch size will expand. In fact, the most hard thing for using “u8glib” is how reduce font size. There is a font “u8g_font_unifont” and you can check detail here. Then watch detail of the font,
u8g_font_unifont BBX Width 16, Height 16, Capital A 10 Font data size: 5551
This font size is 5.5 KB, but Arduino memory size is 32 KB. So you need one-sixth size memory by one font. 
Much ingenuity is required if you want to use multiple fonts.
Font List
Available font on “u8glib” You can use any font on the page. But it’s too many font to choose one. And File size will vary greatly depending on series of the font. If you got a font which you want to use, set the font name to “u8g.setFont” arguments. If you want to use “u8g_font_8x13r” font, for example,
u8g.setFont( u8g_font_8x13r );
Now you can use it. I recommend you to use font that is attached ‘r’ to the end of the name. Because it’s much lighter.
Draw character string
To draw character string,
u8g.drawStr( x, y, character string );
It’s same as graphics drawing. But be careful that axis position of the text is lower left.
#include "U8glib.h"

//U8GLIB_SSD1306_128X64 u8g(4, 5, 6, 7);
U8GLIB_SSD1306_128X64 u8g(U8G_I2C_OPT_DEV_0 | U8G_I2C_OPT_NO_ACK | U8G_I2C_OPT_FAST);

#define VOL  A0
#define VMAX 1013
int vol_val = 0;


void setup() {
  pinMode(VOL, INPUT);
  u8g.setColorIndex(1);
}


void loop() {

  vol_val = 0.9 * vol_val + 0.1 * analogRead(VOL);

  byte val = map(vol_val, 0, VMAX, 0, 127);

  u8g.firstPage();
  do {

    u8g.setFont(u8g_font_8x13r);
    u8g.drawStr( 0, 20, "Hello World!");

    u8g.drawBox(0, 60, val, 3);

  } while (u8g.nextPage());
}
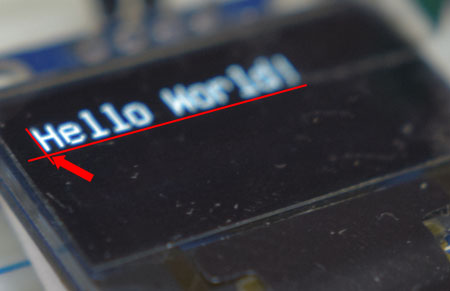
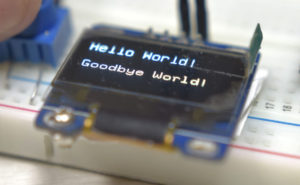
Now you can see how string is drawn. If you want several fonts,
    u8g.setFont(u8g_font_unifont);
    u8g.drawStr( 0, 20, "Hello World!");
    u8g.setFont(u8g_font_8x13r);
    u8g.drawStr( 64, 20, "Goodbye World!");
Use “u8g.setFont” before you draw character.
Once you define font, it is compiled in your sketch even if you don’t use it. Conversely, you should set “u8g.setFont” at “void setup”, if you won’t use any other font.
Draw values
I’m going to draw value by reading variable resistor, now. There are two options to draw value as character, easy way and hard way. The hard way is difficult, of course. But it’s convenient to layout.
option one
set position:u8g.setPrintPos(x, y);
draw value :u8g.print(value);
“Print” functions works as same as “Serial.print”. It’s very simple to draw values.
option two
Make your own character string by pointer. First, I will try to display 1 digit of the value.
#include "U8glib.h"

//U8GLIB_SSD1306_128X64 u8g(4, 5, 6, 7);
U8GLIB_SSD1306_128X64 u8g(U8G_I2C_OPT_DEV_0 | U8G_I2C_OPT_NO_ACK | U8G_I2C_OPT_FAST);

#define VOL  A0
#define VMAX 1013
int vol_val = 0;


void setup() {
  pinMode(VOL, INPUT);
  u8g.setColorIndex(1);
}


void loop() {

  vol_val = 0.9 * vol_val + 0.1 * analogRead(VOL);

  char num [2] = {"0"};
  num [0] = '0' + vol_val % 10;

  u8g.firstPage();
  do {

    u8g.setFont(u8g_font_unifont);
    u8g.drawStr(95, 55, num);

  } while (u8g.nextPage());
}
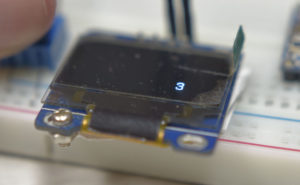
I make array num[2], then set 1 digit of value “vol_val” to it. You can get the digit by ‘%’. And I get ASCII code num by adding ‘0’ to the value. This method is very useful and important. For example, ‘0’ + 5 = ? ‘0’ means number 48 as value on ASCII code. 48 + 5 = 53 So by this method, you can convert int value to number of char. By Converting for each digit by this way, you can display value.
#include "U8glib.h"

//U8GLIB_SSD1306_128X64 u8g(4, 5, 6, 7);
U8GLIB_SSD1306_128X64 u8g(U8G_I2C_OPT_DEV_0 | U8G_I2C_OPT_NO_ACK | U8G_I2C_OPT_FAST);

#define VOL  A0
#define VMAX 1013
int vol_val = 0;


void setup() {
  pinMode(VOL, INPUT);
  u8g.setColorIndex(1);
}


void loop() {

  vol_val = 0.9 * vol_val + 0.1 * analogRead(VOL);

  char num [5] = {"0000"};
  num [0] = '0' + (vol_val / 1000) % 10;
  num [1] = '0' + (vol_val / 100) % 10;
  num [2] = '0' + (vol_val / 10) % 10;
  num [3] = '0' + vol_val % 10;

  u8g.firstPage();
  do {

    u8g.setFont(u8g_font_unifont);
    u8g.drawStr(95, 55, num);

  } while (u8g.nextPage());
}
It will work.
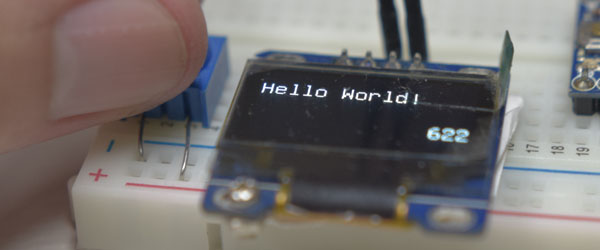
Summary : Simplified sketch to display the values
Finally, I wrote a simplified sketch which displays value by variable resistor.
#include "U8glib.h"

//U8GLIB_SSD1306_128X64 u8g(4, 5, 6, 7);
U8GLIB_SSD1306_128X64 u8g(U8G_I2C_OPT_DEV_0 | U8G_I2C_OPT_NO_ACK | U8G_I2C_OPT_FAST);

#define VOL  A0
#define VMAX 1013
int vol_val = 0;

#define DEG 4                       // digit


void setup() {
  pinMode(VOL, INPUT);
  u8g.setColorIndex(1);             // paint pixel
  u8g.setFont(u8g_font_unifont);    // choose font
}


void loop() {

  vol_val = 0.9 * vol_val + 0.1 * analogRead(VOL);   // get value of VR

  byte val = map(vol_val, 0, VMAX, 0, 127);   // map the value in screen range

  char num_array [DEG + 1];                   // array for VR
  bool space = true;                          // make space depends on digit

  for (byte i = 0 ; i < DEG ; i++)            // repeat for the digit
  {
    // Calculation for the carry digit
    long digit = 1;
    for (byte ii = 1 ; ii <= (DEG - 1 - i) ; ii++) digit *= 10;

    // get a single digit by dividing the value
    byte cur_val = (vol_val / digit) % 10;

    // get highest digit
    if ((vol_val == 0 && i == (DEG - 1)) || cur_val != 0) space = false;

    if (space) num_array [i] = ' ';       // fill array with 0 unless value is over.
    else num_array [i] = '0' + cur_val;   // fill number
  }

  num_array [DEG] = '#include "U8glib.h"
//U8GLIB_SSD1306_128X64 u8g(4, 5, 6, 7);
U8GLIB_SSD1306_128X64 u8g(U8G_I2C_OPT_DEV_0 | U8G_I2C_OPT_NO_ACK | U8G_I2C_OPT_FAST);
#define VOL  A0
#define VMAX 1013
int vol_val = 0;
#define DEG 4                       // digit
void setup() {
pinMode(VOL, INPUT);
u8g.setColorIndex(1);             // paint pixel
u8g.setFont(u8g_font_unifont);    // choose font
}
void loop() {
vol_val = 0.9 * vol_val + 0.1 * analogRead(VOL);   // get value of VR
byte val = map(vol_val, 0, VMAX, 0, 127);   // map the value in screen range
char num_array [DEG + 1];                   // array for VR
bool space = true;                          // make space depends on digit
for (byte i = 0 ; i < DEG ; i++)            // repeat for the digit
{
// Calculation for the carry digit
long digit = 1;
for (byte ii = 1 ; ii <= (DEG - 1 - i) ; ii++) digit *= 10;
// get a single digit by dividing the value
byte cur_val = (vol_val / digit) % 10;
// get highest digit
if ((vol_val == 0 && i == (DEG - 1)) || cur_val != 0) space = false;
if (space) num_array [i] = ' ';       // fill array with 0 unless value is over.
else num_array [i] = '0' + cur_val;   // fill number
}
num_array [DEG] = '\0';                 // set null character to last array
u8g.firstPage();
do {
u8g.drawStr(0, 22, "Hello World!");   // draw character
u8g.drawStr(95, 55, num_array);       // draw value
u8g.drawBox(0, 60, val, 3);           // draw gauge
vol_val = 0.9 * vol_val + 0.1 * analogRead(VOL);   // get VR value on case of "while loop"
} while (u8g.nextPage());
}';                 // set null character to last array

  u8g.firstPage();
  do {

    u8g.drawStr(0, 22, "Hello World!");   // draw character
    u8g.drawStr(95, 55, num_array);       // draw value
    u8g.drawBox(0, 60, val, 3);           // draw gauge

    vol_val = 0.9 * vol_val + 0.1 * analogRead(VOL);   // get VR value on case of "while loop"
  } while (u8g.nextPage());
}
You can display more digit value if you change define of “DEG”. Well, are you able to use u8glib now ? I hope this articles will help you. For more information about ‘u8glib’, check here.
Just wheat i need!!!!
Tanks… Good work for new to oled display
Thanks to comment. Why don’t you check other articles about Arduino.
https://jumbleat.com/about_arduino_articles/
Great help! Arigatoo! I’m stucked in Part 3. I am trying to make ethanol gauge for my car. The sensor outputs 0-5volts. 5 volt means %100 ethanol and 0 means no ethanol. The same sensor output sending pwm signals to show fuel temperature. I found a code here but cant modify for 8glib
https://codebender.cc/sketch:335619#Flex%20Fuel%20Sensor%20to%20OLED%20Sketch.ino
Thank you for comment.
Sorry to say, code of the url seems to be for “Adafruit” library. And I haven’t learn neither the library and how to use the sensor.
So, basically, I can’t help your project. But some rewrite of the code might be workable.
Watch Out! I changed sensor pin 10 to 2.
Good luck!
Thank you! Before the hertz stuff I’m really lost in here and tearing my hairs ;
vol_val = 0.9 * vol_val + 0.1 * analogRead(VOL);
byte val = map(vol_val, 0, VMAX, 0, 127);
Any touch here will make my gauge bar(u8g.drawBox, val) fail! I couldn’t tell that I really understood this code. Basically I’m trying to make the gauge screen (u8g.drawBox(val)) range to accept 0v to 5v and numbers(u8g.drawStr(num)) to 0-100 %
So I modify the code;
vol_val = 5.0 / 1024.0 * (analogRead (VOL) + 0.5) ;
u8g.drawBox(0, 44, val, 22);
but no go!
At first, to be sure, hertz(PWM) is not same as analog voltage. Be careful.
The analogRead() function returns 0-1024 value depends on its system voltage. So if you use 5V arduino, you don’t have to remap value. 5V is 1024, 0V is 0.
But, instead, you should remap the value to OLED pixel range.
For example, if I use 128×64 pixel OLED, screen size value goes 127×63. And,
u8g.drawBox(0, 43, analogRead (VOL) / 1024.0 * 127, 20);
Incidentally, I recommend you use “map()” function to be much easier.
In addition, “0.9 * vol_val + 0.1 * analogRead(VOL);” is very practical way to get stable value.
Check here,
https://jumbleat.com/2016/08/17/reduce_fluctuations/
Hi!
Okay I misunderstood how the sensor works. The sensor send PWM signal 50-150 hertz. So 50hz means %0 Alcohol and 150 hz means %100 alcohol. I get rid of some codes and now it works.
http://img.photobucket.com/albums/v124/cucuman/20170501_035320.jpg
Here is the code;
#include “U8glib.h”
U8GLIB_SH1106_128X64 u8g(13, 11, 10, 9, 8); // SW SPI Com: SCK = 13, MOSI = 11, CS = 10, A0 = 9
int Sensorpin = 2;
float pulsetime = 0;
int hertz = 0;
void setup() {
u8g.setColorIndex(1);
u8g.setFont(u8g_font_fub35n);
}
void loop() {
pulsetime = pulseIn(Sensorpin, HIGH) + pulseIn(Sensorpin, LOW);
hertz = int((1000000 / pulsetime) – 50);
u8g.firstPage();
do
{
u8g.drawBox(25,4,8,34); // dikey I
u8g.drawBox(31,4,15,6); // yatay 1
u8g.drawBox(31,18,15,6); // yatay 2
u8g.drawBox(31,32,15,6); // yatay 3
u8g.setPrintPos(49, 39);
u8g.print(hertz);
u8g.drawBox(0, 44, hertz, 22);
} while (u8g.nextPage());
delay(900);
}
But as you may see the bar graph doesn’t fit to screen. I’m trying to understand how u8g.drawBox(0, 44, hertz, 22); works on a screen range. Thank you for your great help
Ahh you have already told that and u8g.drawBox(0, 44, hertz / 100.0 * 127, 22); fixed it!
Be good project!